
Picture building a network — maybe for a small company or a home lab with Linux servers. You have devices such as switches, routers and servers that need to talk to each other. How do you make sure it runs cleanly? That is where the OSI model comes in. It is a blueprint that splits network communication into seven clear layers so you understand what happens where.
As an aspiring systems integrator the model helps you solve problems systematically instead of guessing in the dark.
What is the OSI model? It stands for Open Systems Interconnection and is a theoretical framework that describes how data travels from one device to another. Each layer has a specific job, from the physical transmission of bits up to the application you see as a user. Why does that matter for you? Because it helps you isolate network faults.
For example: if your Linux machine cannot load a web page, you check the layers step by step — is the cable broken (layer 1), or is it routing (layer 3)? That saves time and nerves in practice.
💡 Tip: Think of the OSI model like an onion — each layer wraps the next, and data is “packed” layer by layer on send and “unpacked” on receive. That makes the process easier to visualise.
Shortinfo
The history explains why the model exists. In the 1970s networks were chaos. Every vendor — think IBM, DEC or Apple — had its own proprietary systems. An IBM network could not talk to a DEC system because there were no shared standards. That produced isolated islands: you could not simply exchange data, and extensions were expensive and complicated.
To change that, the International Organization for Standardization (ISO) developed the OSI model. It was finalised in 1984 and was meant to create an open, standardised base so devices from different vendors could work together.
Picture this: before OSI you were tied to one vendor, as in a closed world. After OSI everything opened — networks became interoperable, and innovation took off.
Before OSI (1970s):
┌─────────────────────────────────────────────────────────────┐
│   Before OSI: proprietary islands                           │
│                                                             │
│   ┌──────────┐   ╳   ┌──────────┐   ╳   ┌───────────┐       │
│   │ IBM net  │ ──╳── │ DEC net  │ ──╳── │ Apple net │       │
│   └──────────┘   ╳   └──────────┘   ╳   └───────────┘       │
│                                                             │
│   No compatibility — each vendor its own stack              │
└─────────────────────────────────────────────────────────────┘
After OSI (from the 1980s):
┌─────────────────────────────────────────────────────────────┐
│   After OSI: open, standardised communication               │
│                                                             │
│   ┌──────────┐   ═   ┌──────────┐   ═   ┌──────────┐        │
│   │ System A │ ═════ │ System B │ ═════ │ System C │        │
│   └──────────┘   ═   └──────────┘   ═   └──────────┘        │
│        ║                                      ║             │
│        ╚══════════════════════════════════════╝             │
└─────────────────────────────────────────────────────────────┘
🔧 Practical example: In your Linux admin role you see this today in tools such as tcpdump or ip link show. They rest on OSI principles to analyse layers. Without the model you would be lost when debugging a network problem.
An important point: the OSI model is theoretical, unlike the TCP/IP model, which is more practical and dominates the internet. TCP/IP has only four layers (Application, Transport, Internet, Link), which map to OSI layers 5–7, 4, 3 and 1–2. Why learn OSI anyway? Because it is more detailed and helps you understand concepts — even when you use TCP/IP in practice.
For example HTTP (OSI layer 7) maps onto the TCP/IP application layer.
❗ Typical pitfall: Many beginners mix OSI up with TCP/IP. Remember: OSI is the teacher that explains; TCP/IP is the worker that builds. In Linux scenarios, such as configuring
iptablesfor firewall rules (layer 3/4), OSI helps you keep the levels apart.
What should you watch? The model follows a top-down approach: you start at the application layer 7 and go down to the physical layer layer 1. On send, data is “packed” (encapsulation) — each layer adds a header. On receive the reverse happens (decapsulation). You need that later when you design networks or hunt faults.
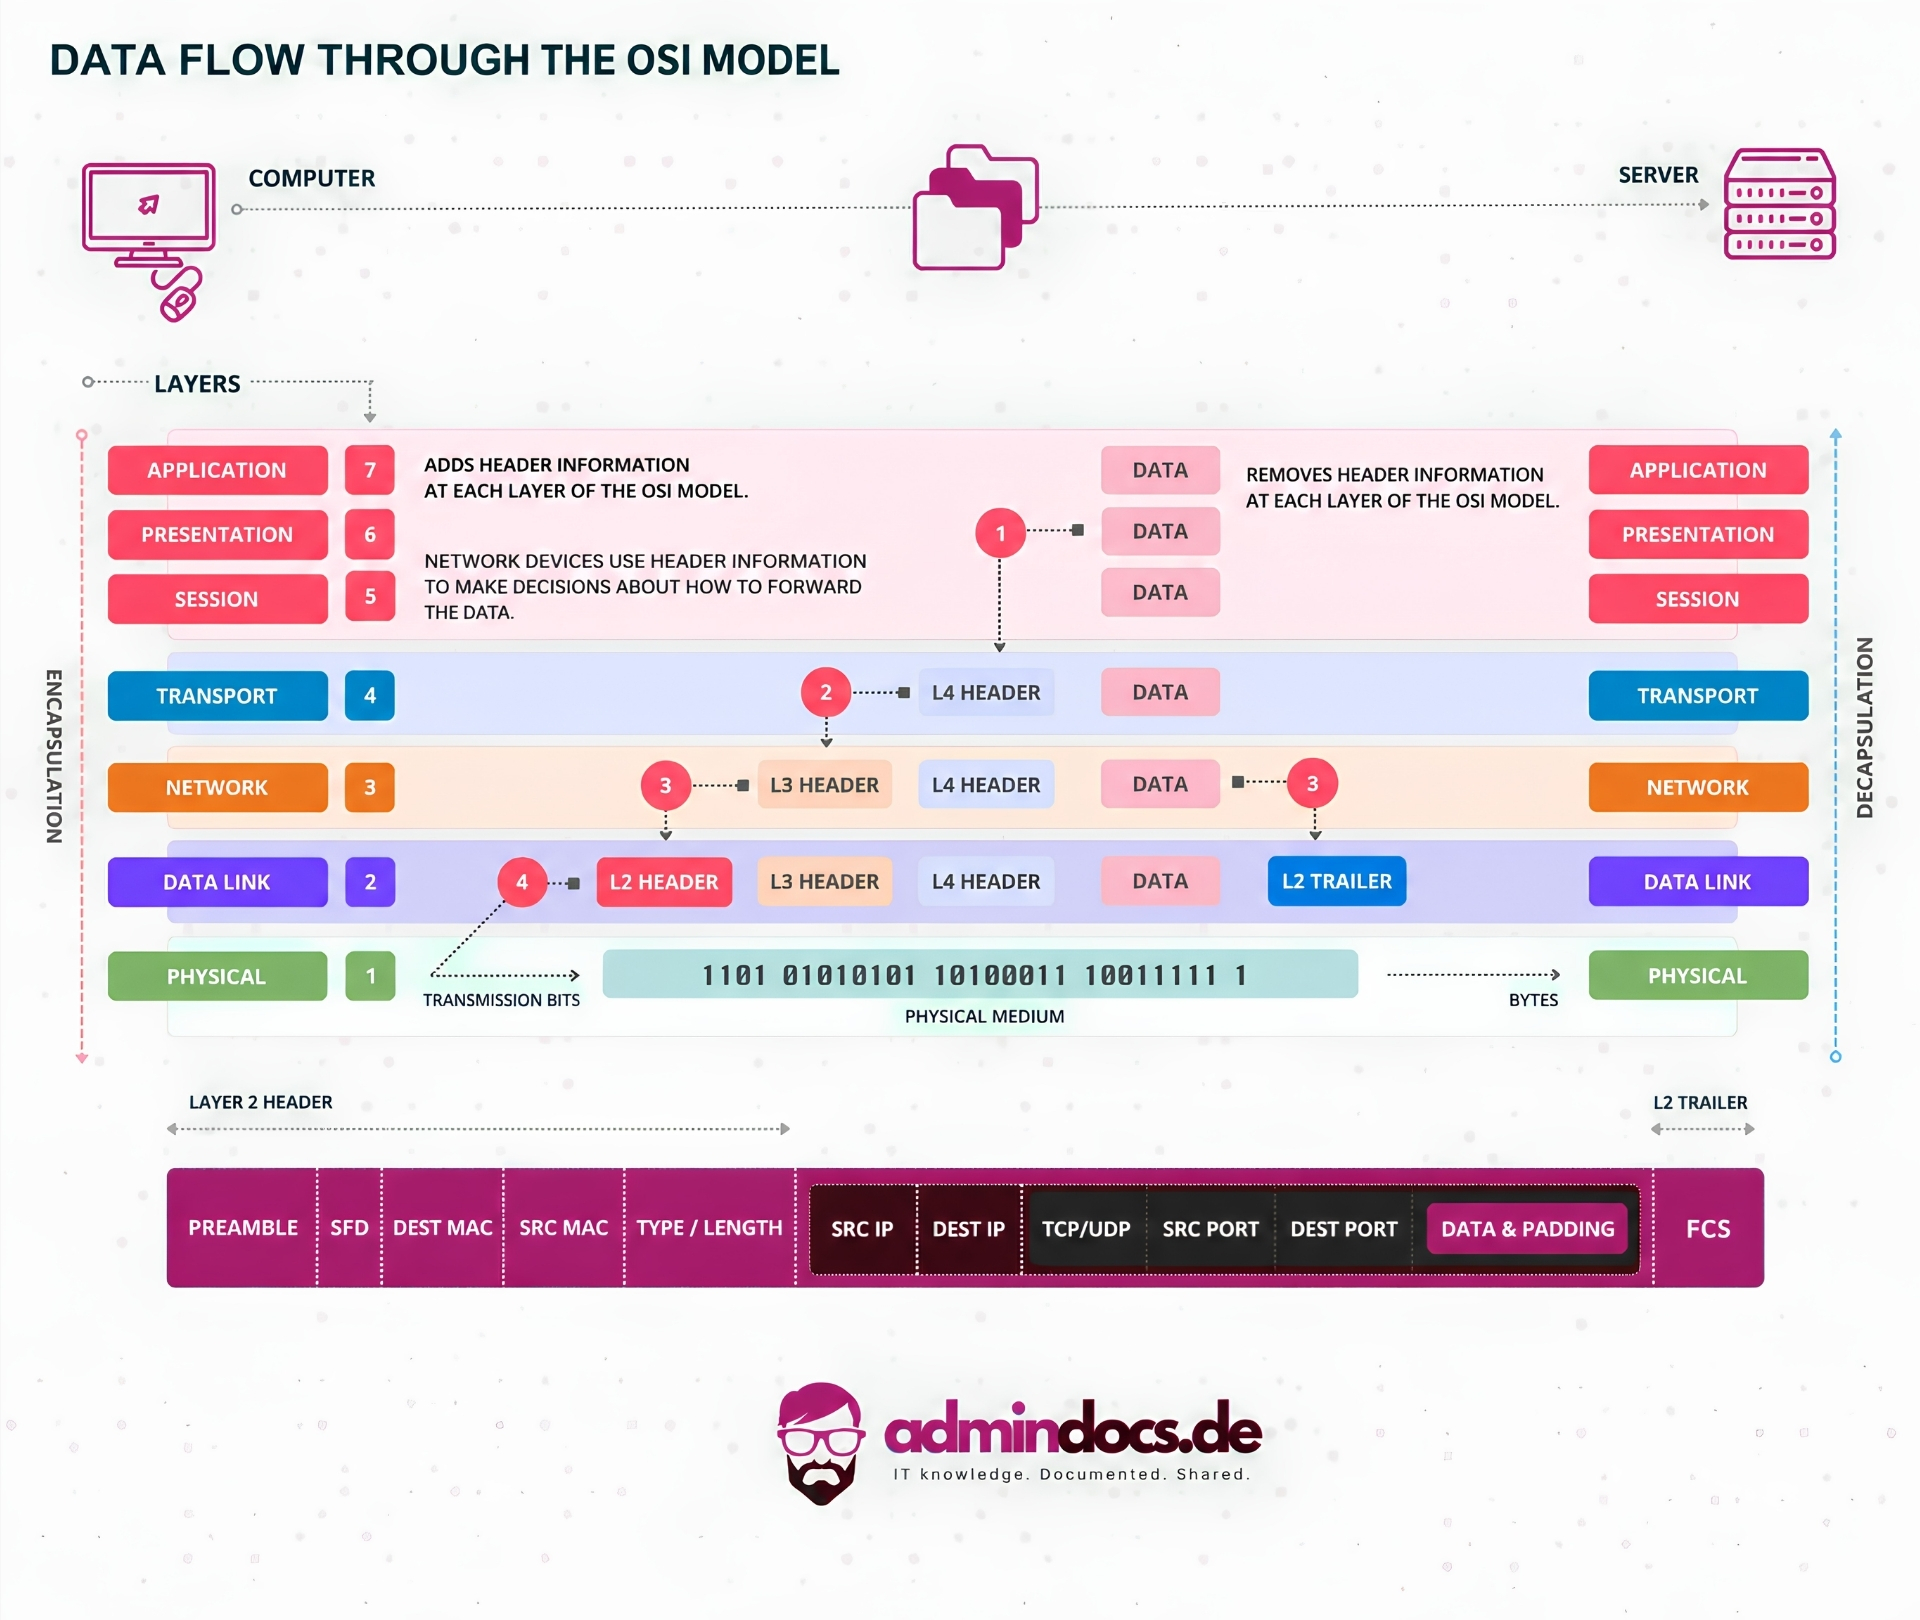
💡 Note: In modern Linux practice, for example in Kubernetes clusters, OSI helps you understand container networks — from pod communication
layer 7down to physical NICslayer 1.
The 7 layers in detail
Layer 7: Application layer
Application Layer
You start at the top, at the layer closest to you as a user.
The application layer is the entry point for all network communication — the interface between you and the rest of the network. This is where the services and protocols you use daily run, often without thinking about them. Opening a browser and loading a page: that is layer 7 in action. The layer lets applications such as your web browser or email client talk to the network by presenting data in a form suitable for communication.
What exactly happens in this layer?
It handles communication at application level, everything that belongs to the programs you see and operate. The layer defines how applications exchange data, offer services and answer requests. At its core it provides network services to end-user applications. Data here is treated as messages or requests that are passed to lower layers.
Unlike deeper layers that deal with bits and packets, layer 7 focuses on content: is this an email? A file transfer? A DNS query?
Why does this layer matter for you as an aspiring systems specialist? Because it is why networks are useful — without it there would be no web pages, no email, no cloud services. In systems integration the understanding helps you configure and troubleshoot applications.
For example: if a server does not accept HTTPS connections, you check here first whether the protocol is implemented correctly. The model makes clear that problems in layer 7 often sit in software, not in the cable.
💡 Tip: Think of
layer 7as the dashboard of a car — you press the accelerator without worrying about the engine. As an admin you still need to know what is under the hood for tuning and repairs.
What should you watch especially? The protocols that live here. Important examples are HTTP and HTTPS for web access, FTP for file transfers, SMTP for sending mail, POP3 and IMAP for receiving mail, and DNS for resolving domain names to IP addresses.
Each protocol has specific rules: HTTP is stateless, without session storage, while HTTPS adds encryption. Watch ports too — HTTP defaults to port 80, HTTPS to 443. On Linux you see that in config files such as /etc/apache2/sites-enabled/ for a web server.
🔧 Practical example: You configure an Apache web server on Ubuntu. You install it with:
sudo apt update
sudo apt install apache2
sudo systemctl start apache2
Then you test with curl http://localhost — that hits layer 7 directly. If it fails, check the firewall with sudo ufw status, because ports may be blocked.
❗ Typical pitfall: Many beginners forget that
layer 7is independent of lower layers. A cable problemlayer 1blocks everything, but a wrong protocol (for exampleHTTPinstead ofHTTPS) only causes application errors. Fix: use tools such asnetstat -tulnorss -tulnon Linux to check open ports and see which services listen.
How do you use this later in practice? In network administration you build secure systems with it. For example you integrate DNS into an internal network with Bind9 on Linux: you bind domains to IPs, which links layer 7 with layer 3. Or you put an Nginx reverse proxy in front that terminates HTTPS.
You need that when you manage cloud environments such as Kubernetes, where pods talk via services at layer 7. That way you avoid holes such as unencrypted connections and scale efficiently.
Application-layer services
┌─────────────────────────────────────────────────────────────┐
│   User applications                                         │
├────────────────────────────┬────────────────────────────────┤
│   HTTP / HTTPS             │   DNS                          │
│   SSH / Telnet             │   SNMP                         │
├──────────────┬─────────────┴────────────────┬───────────────┤
│              │                              │               │
│              ▼                              ▼               │
│        Web and files                 Name resolution        │
└─────────────────────────────────────────────────────────────┘
⚠️ Warning: In zero-trust networks prefer secure protocols — switch from
FTPtoSFTP, because unencrypted transfers can leak data. On Linux you enable that withOpenSSH.
Layer 6: Presentation layer
Presentation Layer
The presentation layer is often underestimated, but it is what keeps data understandable between systems.
It acts as a mediator that makes sure information from the application layer is transferred in a format the receiver can interpret. Imagine sending a file from a Linux server to a Windows client: without this layer, encoding differences — ASCII vs EBCDIC or big-endian vs little-endian — could scramble everything. Here data is formatted, compressed, encrypted or decrypted before it goes to the session layer.
What exactly happens in this layer?
It handles syntax and semantics of the data. That means it converts application-specific data into a neutral format that works across the network. On send it adds headers with information about encoding, compression or encryption. On receive it reverses that: it decodes, decompresses and makes the data usable for the layer above.
Protocols such as SSL and TLS (often associated with layer 7, but acting here for encryption) or formats such as JPEG for images and MPEG for video play a role. On Linux you see this in file transfers, where tools such as iconv convert character sets to avoid compatibility problems.
Why does this layer matter? It prevents misunderstandings in mixed environments, such as a network with Linux, Windows and macOS. Without it, cross-platform transfers would be chaotic — think of emails with attachments that arrive corrupt on one system.
In systems integration it helps you build stable services, especially in cloud migrations or IoT setups where devices use different formats. It also covers encryption, which is essential under privacy rules such as the GDPR.
💡 Tip: Think of
layer 6as an interpreter that makes sure both sides speak the same language. As an admin you need to know which languages (formats) your network understands, to avoid data loss.
What should you watch especially? Compatibility traps such as character-set differences (UTF-8 is standard on Linux, but older systems may use ISO-8859) or byte order on CPUs. Watch compression algorithms such as gzip or deflate too: they save bandwidth but can add overhead. In practice you check with commands such as file -i file.txt on Linux to see MIME type and charset.
And do not forget: encryption here is end-to-end, so check certificates with openssl s_client -connect server:443 to make sure TLS is formatted correctly.
🔧 Practical example: You transfer a CSV file from a Linux server to a client. If line endings (LF vs CRLF) do not match, it becomes unreadable. Convert with:
iconv -f UTF-8 -t ISO-8859-1 input.csv -o output.csv
dos2unix output.csv
That adjusts the format and simulates the work of layer 6. Test it in a Docker container for an isolated environment:
docker run -it ubuntu bash
apt update && apt install -y dos2unix iconv
# Then run the commands
❗ Typical pitfall: Ignored compression leads to high latency on slow nets. Fix: enable gzip in web servers such as Nginx via
gzip on;in the config — that compresses HTTP responses automatically. Or on file transfers usetar -czf archive.tar.gz directory/to pack data before sending.
How do you use this later in practice? When setting up secure connections in Linux clusters, for example with Kubernetes, where you encrypt secrets. Or in backup scripts: you compress logs with gzip and make sure receivers can decompress them. In enterprise setups it helps you integrate APIs — make sure JSON/XML is formatted to avoid parse errors.
That way you build robust systems that scale without format problems disrupting operations.
Presentation layer in action
┌─────────────────────────────────────────────────────────────┐
│   Sender: application data                                  │
│   ↓ formatting / compression                                │
│   ↓ encryption (e.g. TLS)                                   │
│   ↓ neutral network format                                  │
├──────────────────────────┬──────────────────────────────────┤
│                          │                                  │
│                          ▼                                  │
│                   Network transfer                          │
│                          │                                  │
│                          ▼                                  │
├──────────────────────────┴──────────────────────────────────┤
│   Receiver: neutral format                                  │
│   ↑ decryption                                              │
│   ↑ decompression                                           │
│   ↑ system-specific format                                  │
└─────────────────────────────────────────────────────────────┘
❗ Watch out: In IoT networks with limited compute, avoid heavy encryption in
layer 6because it can overload devices — pick lighter algorithms such asAES-128.
Layer 5: Session layer
Session Layer
This layer keeps track of ongoing conversations on the network.
Layer 5 is like a conductor who keeps the musicians in time. The session layer manages setup, flow and teardown of communication sessions between applications on different devices. Think of a video call: without this layer the stream would break and you would not know where to resume. It coordinates the dialogue, synchronises data streams and allows resume after faults by setting checkpoints — like bookmarks in a book.
What exactly happens in this layer?
It takes session management in three phases:
setup, control and teardown. On setup, parameters such as authentication, duplex mode (full-duplex for bidirectional communication, half-duplex for taking turns) and synchronisation rules are agreed. During control it keeps order — who sends when, and how several streams (for example audio and video) are combined. On teardown the session ends cleanly so resources are freed. Protocols such as SIP for VoIP, RPC for remote calls or NetBIOS for local nets belong here.
On Linux you see this in services such as SSH, where sessions are built with ssh user@host, or in systemd-logind, which handles user sessions.
Why does this layer matter? It ties applications together reliably, which is decisive in distributed systems. Without it, cloud services such as Kubernetes pods could not run in sync, or IoT devices would drop connections. In systems integration you use it to build resilient nets — think failover in high-availability clusters, where checkpoints prevent data loss.
It also helps against attacks such as session hijacking, where an attacker takes over a session.
💡 Tip: Treat layer 5 as the “calendar” of your network — it plans who speaks when and notes pauses so nothing is lost. That helps later when you orchestrate Docker containers and sessions must stay stable across networks.
What should you watch especially? Dialogue control modes: simplex (one way, like broadcasting), half-duplex (taking turns, like a walkie-talkie) or full-duplex (at the same time, like a phone). Synchronisation is key — checkpoints mark points where you continue after a drop, for example on file transfers. Watch protocols such as L2TP and PPTP for VPNs or WebRTC for real-time communication.
On Linux you check sessions with who or loginctl list-sessions to see running user sessions. And do not forget: this layer works closely with layer 4 (transport), which delivers the segments, and layer 6 (presentation), which provides the formatted data.
🔧 Practical example:
You manage SSH sessions on a server. Start one with:
ssh user@remote-host
To monitor sessions, use:
loginctl list-sessions
loginctl show-session <session-id>
In a Docker setup for test environments:
docker run -d -p 22:22 --name ssh-container rastasheep/ubuntu-sshd:18.04
ssh root@localhost -p 22  # Password: root
That simulates session management — end with exit, and check logs with docker logs ssh-container.
❗ Typical pitfall: Missing synchronisation leads to inconsistent data, for example on interrupted downloads. Fix: implement checkpoints in scripts, such as
rsync --partialfor partial transfers, which makes sessions resilient. Or on APIs: use tokens for stateful sessions to avoid hijacking.
How do you use this later in practice? When configuring VoIP systems such as Asterisk on Linux, where SIP sessions are coordinated. Or in cloud environments: Kubernetes uses sessions for pod communication, and you set checkpoints with StatefulSets. In backup routines you synchronise streams with tools such as rclone, which handles drops.
That way you keep enterprise nets — from 5G to edge computing — stable without users noticing interruptions.
Session-layer phases
┌─────────────────────────────────────────────────────────────┐
│   Phase 1: setup                                            │
│   * authentication                                          │
│   * agree the mode                                          │
│   * set parameters                                          │
├──────────────────────────┬──────────────────────────────────┤
│                          ▼                                  │
├─────────────────────────────────────────────────────────────┤
│   Phase 2: control                                          │
│   * control the dialogue                                    │
│   * synchronisation (checkpoints)                           │
│   * combine streams                                         │
├──────────────────────────┬──────────────────────────────────┤
│                          ▼                                  │
├─────────────────────────────────────────────────────────────┤
│   Phase 3: teardown                                         │
│   * clean shutdown                                          │
│   * free resources                                          │
│   * keep logs                                               │
└─────────────────────────────────────────────────────────────┘
⚠️ Warning: In zero-trust setups avoid open-ended sessions — enable timeouts in SSH with
ClientAliveInterval 300insshd_configto drop idle connections and reduce attacks.
Layer 4: Transport layer
Transport Layer
This is the first layer that builds true end-to-end communication between sender and receiver
independent of how many routers or switches sit in between. The transport layer segments data from the session layer, packs it into transport units (segments for TCP, datagrams for UDP) and makes sure they arrive at the target process reliably or quickly.
This is where ports are introduced: the layer decides which application on the destination host should get the data. Without layer 4 the receiver would not know whether a packet is for the web server (port 443), SSH (port 22) or a Kubernetes pod (for example port 8080).
What exactly happens here?
The layer takes four core jobs:
- 1. Segmentation and reassembly — large streams are split into manageable segments and put back together on the receiver.
- 2. Port addressing — source and destination port are written into the header (16 bit → 0–65535).
- 3. Connection control — TCP builds a virtual connection, UDP does not.
- 4. Flow and congestion control — TCP stops the receiver being overloaded (windowing) and adapts send speed to network load.
The two most important protocols are TCP and UDP — and this is where you decide whether your application should be reliable or fast.
💡 Tip: Remember the difference like this:
TCPis the tracked parcel service with delivery confirmation,UDPis a letter without a return receipt — fast, but if it is lost you notice later (or not at all).
TCP — the reliable workhorse
Connection-oriented, with 3-way handshake, sequence numbers, ACKs, retransmission and congestion control. Perfect for HTTP/S, SSH, email, file transfers — anywhere no bit may be missing.
┌─────────────────────────────────────────────────────────────┐
│   TCP 3-way handshake                                       │
│                                                             │
│   ┌────────┐                                   ┌────────┐   │
│   │ Client │ ────────────── SYN ─────────────▶ │ Server │   │
│   │        │ ◀─────────── SYN / ACK ────────── │        │   │
│   │        │ ────────────── ACK ─────────────▶ │        │   │
│   └────────┘                                   └────────┘   │
│                                                             │
│                      Connection is up                       │
└─────────────────────────────────────────────────────────────┘
UDP — the speed king
Connectionless, no handshake, no guarantee. Minimal overhead instead. Ideal for DNS queries, VoIP, streaming, online gaming, NTP — anywhere speed matters more than completeness.
🔧 Practical example: Check ports and connections on Linux:
# Show all listening TCP/UDP ports
ss -tuln

# Decode a sample output
Netid  State    Recv-Q   Send-Q     Local Address:Port   Peer Address:Port
tcp    LISTEN   0        128        0.0.0.0:22          0.0.0.0:*      # SSH listening
tcp    LISTEN   0        128        127.0.0.1:25        0.0.0.0:*      # SMTP local
udp    UNCONN   0        0          0.0.0.0:68          0.0.0.0:*      # DHCP client
With ss -tunap you even see which process owns the port — gold when troubleshooting.
🔧 Practical example: Watch a TCP handshake live with tcpdump:
sudo tcpdump -i eth0 tcp port 443 -n
# Then open https://example.com in the browser
# You see SYN → SYN/ACK → ACK
❗ Typical beginner pitfall: You block only TCP port
80with the firewall (for exampleufw), but HTTPS (TCP443) stays open. Or you forget thatUDPdoes not build a connection — on DNS problemsdig @8.8.8.8 google.comimmediately shows whether port53/UDPis blocked.
Practical firewall example with nftables (the modern default on current Ubuntu and Arch):
# Allow only SSH and HTTPS, drop the rest
sudo nft add table inet filter
sudo nft add chain inet filter input { type filter hook input priority 0 \; policy drop \; }
sudo nft add rule inet filter input tcp dport { 22, 443 } accept
sudo nft add rule inet filter input iif lo accept   # Free loopback
That is pure layer-4 firewalling — you filter by port and protocol.
How do you use this in daily admin practice? In container environments such as Docker or Kubernetes, ports are everything. A pod that listens internally on port 8080 is exposed via a Service on NodePort 30080 — that is layer 4 work.
With iptables -t nat -L -n -v or nft list ruleset you see the DNAT rules that redirect the traffic.
Or for performance tuning:
Adjust TCP window scaling and the congestion algorithm:
# Check the current algorithm
sysctl net.ipv4.tcp_congestion_control
# Switch to bbr (good for high latency/path)
sudo sysctl -w net.ipv4.tcp_congestion_control=bbr
That can bring 30–50 % more throughput to backup servers a long way away.
Segment vs datagram:
┌─────────────────────────────────────────────────────────────┐
│   TCP segment                                               │
│   ┌─────────────────────────────────────────────────────┐   │
│   │ TCP header (ports, seq, ACK, flags)                 │   │
│   ├─────────────────────────────────────────────────────┤   │
│   │ Application data                                    │   │
│   └─────────────────────────────────────────────────────┘   │
│                                                             │
│   UDP datagram                                              │
│   ┌─────────────────────────────────────────────────────┐   │
│   │ UDP header (only 8 bytes: ports, length)            │   │
│   ├─────────────────────────────────────────────────────┤   │
│   │ Application data                                    │   │
│   └─────────────────────────────────────────────────────┘   │
└─────────────────────────────────────────────────────────────┘
❗ Watch out: In cloud and container environments more and more UDP-based protocols are used (
QUIC,HTTP/3,WireGuard). If you only haveTCPin mind, you quickly miss security holes or performance problems — always check both protocols withss -uforUDPandss -tforTCP.
Layer 4 is the layer where you as an admin spend the most time — opening ports, debugging connections, writing firewall rules and tuning performance. If you master it, you have 80 % of all network problems under control.
Layer 3: Network layer
Network Layer
This is the layer that actually connects networks
It makes sure data reaches its destination not only locally, but across different nets. The network layer handles logical addressing and routing of packets, so the decision which path the data should take. Imagine sending an email from your server to a friend in another country: layer 3 packs the segments from the transport layer into IP packets, assigns logical addresses (IP addresses) and forwards them through routers.
Without this layer, networks would stay local, and the internet as we know it would be impossible.
What exactly happens in this layer?
It takes packetisation: segments become packets, with headers that contain source and destination IP, TTL (time to live, to prevent loops) and further info such as fragmentation for packets that are too large. Routing is the core — routers look in routing tables and pick the best path based on metrics such as hop count or bandwidth. Protocols such as IP (IPv4, IPv6), ICMP (for ping and errors), IGMP (multicast) and routing protocols (RIP, OSPF, BGP) run here.
On Linux you see this in ip route show, where you see how packets are routed.
Why does this layer matter? It is the foundation of scalable nets — without routing there would be no WAN, no cloud connectivity or VPNs. In systems integration it helps you plan subnets, configure NAT and optimise traffic. With IPv6 and edge computing you need to be solid here to manage migrations or set IP-based firewall rules.
💡 Tip: Think of
layer 3as a sorting office — it sorts letters by address and picks the route (car, train, plane), but does not care about the contents or delivery guarantee (that islayer 4).
What should you watch especially?
On IP addressing: IPv4 (32 bit, for example 192.168.1.1) is scarce, IPv6 (128 bit, for example 2001:db8::1) is vast. Subnetting splits nets (CIDR notation such as /24) to avoid collisions. Fragmentation splits packets when MTU (maximum transmission unit) is exceeded — check that with ip link show.
And routing: static (manual) vs dynamic (protocols learn routes). On Linux you set static routes with ip route add.
🔧 Practical example:
Configure static routing on Ubuntu to reach a subnet:
# Show current routes
ip route show

# Add a static route (e.g. to 10.0.0.0/24 via gateway 192.168.1.1)
sudo ip route add 10.0.0.0/24 via 192.168.1.1 dev eth0

# Add an IPv6 route
sudo ip -6 route add 2001:db8:1::/64 via 2001:db8::1 dev eth0
Test with ping 10.0.0.1 or ping6 2001:db8:1::1 — if it fails, it is often a wrong gateway.
In Docker: on networks such as bridge or overlay you see layer-3 routing in action. Create a custom net:
docker network create --subnet=172.18.0.0/16 mynet
docker run -d --network mynet --ip 172.18.0.2 nginx
# Ping from the host: ping 172.18.0.2
❗ Typical pitfall: IP conflicts or wrong subnet masks — packets never arrive. Fix: use
arp -afor ARP tables (resolving IP to MAC) ortraceroute google.comto track the path and find bottlenecks.
How do you use this later in practice?
On VPN setups with WireGuard: you route traffic through tunnels (layer 3). Or in Kubernetes: Ingress controllers handle routing at IP level. For security: set ACLs in routers or with nftables — block IPs:
sudo nft add table ip filter
sudo nft add chain ip filter input { type filter hook input priority 0 \; policy accept \; }
sudo nft add rule ip filter input ip saddr 192.168.1.100 drop  # Block one IP
That protects against spoofing. In large nets you optimise with OSPF via the FRR daemon — install with apt install frr and configure /etc/frr/frr.conf.
Routing process:
┌─────────────────────────────────────────────────────────────┐
│   Routing in layer 3                                        │
│                                                             │
│   ┌──────────────┐                                          │
│   │ Source:      │                                          │
│   │ 192.168.1.10 │                                          │
│   └──────┬───────┘                                          │
│          │ packet with dest IP 8.8.8.8                      │
│          ▼                                                  │
│   ┌──────────────┐                                          │
│   │ Router 1     │  ← looks up next hop in the table        │
│   │ Gateway      │                                          │
│   └──────┬───────┘                                          │
│          │ via ISP router                                   │
│          ▼                                                  │
│   ┌──────────────┐                                          │
│   │ Router 2     │  ← TTL decremented, fragment if needed   │
│   └──────┬───────┘                                          │
│          ▼                                                  │
│   ┌──────────────┐                                          │
│   │ Destination: │                                          │
│   │ 8.8.8.8      │                                          │
│   └──────────────┘                                          │
└─────────────────────────────────────────────────────────────┘
⚠️ Warning: On IPv6 migration watch dual-stack — many systems fall back to IPv4, which adds latency. Enable IPv6 with
sysctl -w net.ipv6.conf.all.disable_ipv6=0and test withip -6 addr show.
Layer 2: Data link layer
Data Link Layer
Layer 2, the data link layer, is the transition from logical to physical — it organises data into frames and provides error-aware transfer over a local medium. It takes packets from the network layer, frames them, adds physical addresses (MAC addresses) and detects errors with checksums.
Imagine connecting two Linux machines through a switch: layer 2 makes sure frames arrive correctly without higher layers intervening. It also handles medium access (for example CSMA/CD on Ethernet) and enables point-to-point or broadcast communication in LANs.
What exactly happens in this layer?
It splits into two sublayers: LLC (Logical Link Control) for flow control and error correction, and MAC (Media Access Control) for addressing and medium access. Frames get a header (for example destination MAC, source MAC, length) and a trailer (CRC for error detection). When errors are detected, it can request retransmission (for example via ARQ). Protocols such as Ethernet, PPP, Wi-Fi (802.11) or VLANs (802.1Q) live here.
On Linux you see this in ip link show, where you check MTU, MAC and interface status.
Why does this layer matter? It is the key to local nets — without it switches could not learn where frames go, and your home lab would collapse. In systems integration it helps you segment VLANs to isolate traffic, or build bridges for virtual nets. Especially in container environments such as Docker, where virtual interfaces (veth) simulate layer 2, you need this to manage network isolation.
💡 Tip: See
layer 2as the “postman in the building” — he delivers letters to the right flat (MAC), but only inside the building (LAN), not across the city (that islayer 3).
What should you watch especially? MAC addresses (48 bit, for example 00:11:22:33:44:55), which are hardware-based and resolved to IPs via ARP. Framing stops bits being seen as an endless stream — preamble and delimiter mark start/end. Error detection uses CRC or parity, but correction is optional (usually detection only). On wireless nets watch CSMA/CA to avoid collisions.
On Linux you change MAC with ip link set dev eth0 address 00:aa:bb:cc:dd:ee — useful for tests.
🔧 Practical example:
Watch frames with ethtool and tcpdump on Ubuntu:
# Show interface details (MTU, duplex, speed)
ethtool eth0

# Change MAC (temporary)
sudo ip link set eth0 down
sudo ip link set eth0 address 00:11:22:33:44:55
sudo ip link set eth0 up

# Sniff frames
sudo tcpdump -i eth0 -e -nn  # -e shows layer-2 headers (MAC)
In Docker: create a bridge net that simulates layer 2:
docker network create --driver bridge mybridge
docker run -d --network mybridge busybox sleep infinity
# Inspect: docker network inspect mybridge  # Shows container MACs
❗ Typical pitfall: Duplex mismatch (one device full-duplex, the other half) leads to collisions and packet loss. Fix: set with
ethtool -s eth0 autoneg off speed 1000 duplex full— but test first withmii-tool.
How do you use this later in practice? On VLAN configuration with the vlan module: load it with modprobe 8021q and create interfaces via ip link add link eth0 name eth0.10 type vlan id 10. That segments traffic into secure zones. In Kubernetes you use Calico or Flannel for layer-2 overlays to connect pods.
For security: implement MACsec (802.1AE) for encrypted frames — install wpasupplicant and configure it. That protects LANs against sniffing.
Frame layout:
┌─────────────────────────────────────────────────────────────┐
│   Ethernet frame                                            │
│                                                             │
│   ┌──────┬─────────┬─────────┬────────┬──────────┬──────┐   │
│   │ Pre. │ Dest MAC│ Src MAC │ Typ/L. │ Payload  │ CRC  │   │
│   ├──────┼─────────┼─────────┼────────┼──────────┼──────┤   │
│   │ (7B) │ (6 B)   │ (6 B)   │ (2 B)  │ 46-1500  │ (4B) │   │
│   └──────┴─────────┴─────────┴────────┴──────────┴──────┘   │
└─────────────────────────────────────────────────────────────┘
Layer 1: Physical layer
Physical Layer
Now you are at the base everything else sits on — the physical layer, which transmits bits as electrical, optical or wireless signals.
The physical layer defines how data is sent as 0s and 1s over copper, fibre or radio, including voltage levels, bit rates, connectors and modulation.
Picture plugging an Ethernet cable into your Linux server: layer 1 makes sure the signals arrive physically, without higher layers involved. It handles the hardware interface, such as NICs (network interface cards), hubs or repeaters, and provides raw bit transfer — no addressing or error correction, just pure transport.
What exactly happens in this layer?
It converts digital bits into analogue signals (coding such as Manchester encoding) and back. Parameters such as bit rate (for example 1 Gbit/s), duplex mode (full/half), medium (copper, fibre, wireless) and topology (bus, star, ring) are set. Standards such as Ethernet (IEEE 802.3), Wi-Fi (802.11) or RS-232 apply.
On Linux you see this with ethtool eth0, where you check speed, duplex and autonegotiation — the layer is hardware-based, but tools give insight.
Why does this layer matter?
Without a stable physical link everything above fails — a broken cable blocks your whole net. In systems integration it helps you spot hardware problems early, for example in rack setups or IoT deployments, where cable quality makes the difference. Especially in datacentres with 400G Ethernet, layer 1 is the first place a “no carrier” fault shows up.
💡 Tip: Treat layer 1 as the foundation of a house — stable, but invisible. If it wobbles, you only notice when the rest collapses. That saves you hours debugging higher layers.
What should you watch especially?
Medium-specific limits: copper (Cat6 up to 100 m at 10G), fibre (single-mode over kilometres), wireless (frequencies such as 2.4/5/6 GHz with interference). Watch synchronisation (clocking), signal strength (attenuation) and noise (SNR). On wireless nets check channels to avoid overlap.
On Linux test with iwconfig wlan0 for Wi-Fi details or mii-tool eth0 for copper status.
🔧 Practical example:
Check and set link parameters on Ubuntu:
# Show link status
ip link show eth0

# Details with ethtool
ethtool eth0  # Shows speed, duplex, MDI-X

# Set speed/duplex by hand (e.g. for old hardware)
sudo ethtool -s eth0 autoneg off speed 100 duplex full
In Docker: test physical connections in containers via the host interface:
docker run -it --network host ubuntu bash
ethtool eth0  # Uses the host's layer 1
❗ Typical pitfall: Wrong cable category (for example Cat5 at 10G) leads to bit errors. Fix: use
ethtool -t eth0for offline tests orping -s 1500 -f targetto check MTU and signal quality — high packet loss points to layer-1 problems.
How do you use this later in practice?
In server racks: pick SFP modules for fibre (for example 10GBASE-SR) and configure with ip link set dev eth0 up. In wireless setups with hostapd you build APs: install hostapd and edit /etc/hostapd/hostapd.conf for channel/signal. For monitoring: integrate lm-sensors or ipmitool to check temperature/voltage that affect signals.
That way you build reliable infrastructure, for example for Kubernetes clusters, where physical links are the base for overlays.
Signal transfer:
┌─────────────────────────────────────────────────────────────┐
│   Bit transfer in layer 1                                   │
│                                                             │
│   ┌──────────────┐                                          │
│   │ Sender NIC   │                                          │
│   └──────┬───────┘                                          │
│          │ bits: 101010...                                  │
│          ▼ encoding (e.g. NRZ)                              │
│   ┌──────────────┐                                          │
│   │ Medium       │  ← signal (electrical / optical)         │
│   │ (cable/radio)│    attenuation, noise                    │
│   └──────┬───────┘                                          │
│          ▼ decoding                                         │
│   ┌───────────────┐                                         │
│   │ Receiver NIC  │                                         │
│   └───────────────┘                                         │
└─────────────────────────────────────────────────────────────┘
Interaction between the layers
Encapsulation and decapsulation
Now that you know the individual layers, this is how they work together — the glue that brings the OSI model to life.
Encapsulation is the process on the sender
Data is “packed” layer by layer, and each layer adds headers (and sometimes trailers) needed for its job.
Decapsulation is the opposite on the receiver
The layers remove those headers step by step to uncover the original data. Imagine sending a file via SCP from one Linux server to another: encapsulation builds the packets, decapsulation takes them apart — bits travel safely through the net without you steering the process by hand.
What exactly happens in encapsulation?
It starts in layer 7:
Application data (for example a JSON message) is passed to layer 6, which formats and encrypts (for example adds a TLS header). Layer 5 adds session info (for example a token for resume). Layer 4 segments and adds TCP/UDP headers (ports, sequence numbers). Layer 3 packets with an IP header (IPs, TTL). Layer 2 frames with MAC header/trailer (MACs, CRC). Layer 1 finally turns that into signals.
Each header holds control info the next layer needs — that makes the process modular and fault-tolerant.
On the receiver everything reverses:
Layer 1 receives signals and rebuilds bits into frames. Layer 2 checks CRC, removes the MAC header and hands packets to layer 3. Layer 3 checks IP, routes locally and removes the header. Layer 4 reassembles segments, handles ACKs and delivers to layer 5. Layer 5 manages the session, layer 6 decompresses and decrypts, layer 7 presents the raw data to the application.
On Linux you see this in tools such as Wireshark, where you dissect the whole stack.
Why does this interaction matter? It explains why networks scale — each layer is independent, but cooperative. In systems integration it helps you isolate problems: if encapsulation fails in layer 3 (wrong IP), you see it in logs without debugging the whole stack. Especially in containerised environments such as Docker, where virtual nets simulate encapsulation, you need this to cut overhead and optimise performance.
💡 Tip: Visualise
encapsulationlike sending a parcel: you pack the contents (data) in a box (segment), address it (packet), stamp it (frame) and hand it over (bits).Decapsulationis unpacking — layer by layer, until the contents are there.
What should you watch especially?
Overhead: each header grows the payload (for example TCP header 20–60 bytes, IP 20 bytes) — on slow nets that adds up. Watch MTU (typically 1500 bytes) to avoid fragmentation, which complicates decapsulation. On wireless nets layer 1 adds noise that loads higher layers.
On Linux you adjust MTU with ip link set eth0 mtu 9000 for jumbo frames, but only if every device plays along.
🔧 Practical example: Analyse encapsulation with tcpdump on Ubuntu — capture an HTTP request:
sudo tcpdump -i eth0 -XX -c 10 port 80  # -XX shows hex/ASCII, including headers
# Start curl http://example.com
# In the output you see: Ethernet frame (layer 2), IP packet (3), TCP segment (4), HTTP data (7)
In Docker: simulate with two containers — encapsulation on virtual interfaces:
docker network create mynet
docker run -d --name sender --network mynet busybox sleep infinity
docker run -d --name receiver --network mynet busybox sleep infinity
docker exec sender ping -c 1 receiver  # tcpdump on the host shows encapsulation
❗ Typical pitfall: Mismatched MTU leads to “black hole” effects — packets vanish because
fragmentationis blocked. Fix: setip link set eth0 mtu 1400for VPN tunnels and test withping -M do -s 1472 target(do = don’t fragment).
How do you use this later in practice?
On network debugging in Kubernetes: use k9s or kubectl exec to sniff pods — see how Calico handles encapsulation for overlays. In backup scripts: SCP uses SFTP (layer 7), but encapsulation keeps packets safe — optimise with rsync -z for compression in layer 6.
For security: IPsec adds encapsulation (AH/ESP headers) — configure with strongSwan on Linux to build tunnels. That way you create secure, efficient connections, for example in hybrid clouds.
The encapsulation process:
┌─────────────────────────────────────────────────────────────┐
│   Encapsulation (sender)                                    │
│                                                             │
│   L7: data                                                  │
│      │ + L6 header (format)                                 │
│      ▼                                                      │
│   L6: PDU                                                   │
│      │ + L5 header (session)                                │
│      ▼                                                      │
│   L5: PDU                                                   │
│      │ + L4 header (ports / seq)                            │
│      ▼                                                      │
│   L4: segment                                               │
│      │ + L3 header (IPs / TTL)                              │
│      ▼                                                      │
│   L3: packet                                                │
│      │ + L2 header/trailer (MACs / CRC)                     │
│      ▼                                                      │
│   L2: frame                                                 │
│      │ → L1: bits / signals                                 │
│                                                             │
│   Decapsulation (receiver): reverse — strip headers ↑       │
└─────────────────────────────────────────────────────────────┘
Misunderstandings and tips
When you start with the OSI model, many people hit similar traps, especially if you come from Linux admin practice and wonder why a theoretical model matters in daily work with ip or ethtool. The following sections clear the most common misunderstandings and add practical tips so you avoid them.
As a beginner that helps you see the model not as dry theory, but as a toolbox for real problems such as network outages in a server cluster.
❗ Misunderstanding 1: The OSI model is obsolete and never used in practice — TCP/IP is enough. Many think so because
TCP/IPdominates the internet and OSI is only theory. That is not true: OSI is a reference for structuring problems. On Linux you see that when you analyse a capture withwireshark— you filter by layers, for exampletcp.port == 80for layer 4/7. Always start with OSI to check whether an issue sits inlayer 1(cable) orlayer 3(routing).
In practice: on a Kubernetes cluster that does not communicate, you check layer by layer — often it is a layer-2 switch loop, not the pod code.
💡 Tip: Practise with
tcpdump -i any -nnand filter layers:-efor layer 2 (MAC),ipfor layer 3. That way you see how theory lives in real-time packets.
❗ Misunderstanding 2: The layers are strictly separate and do not interact. Beginners often believe each layer works in isolation, but
encapsulationshows the opposite — headers from higher layers are embedded in lower ones. That leads to errors, for example if you set a firewall only onlayer 4and letlayer 7attacks (such as SQL injection via HTTP) through.
On Linux: nftables can do deep inspection, but start with the basics.
💡 Tip: When debugging, use
straceon network commands, for examplestrace curl example.com, to see how syscalls touch layers — from socket creation (layer 4) to send (layer 1).
🔧 Practical example: Simulate a misdiagnosis in Docker — a container cannot reach the host:
docker run -it --rm ubuntu bash
# In the container: ping 8.8.8.8  # Works (layer 3+)
# But curl example.com fails? Check layer 7/4 with telnet example.com 80
# Often it is DNS (layer 7) — fix with echo "nameserver 8.8.8.8" > /etc/resolv.conf
That shows how misunderstandings lead to wrong assumptions — test layer by layer.
❗ Misunderstanding 3: Layer 1 is only cables — no software involved. Many underestimate that
layer 1is software-driven, for example via NIC drivers. A broken driver crashes your whole net, not only hardware.
On Linux: lspci -v | grep Ethernet shows kernel modules.
💡 Tip: On link problems reload modules with
modprobe -r e1000 && modprobe e1000— that often fixes “No carrier” errors without changing the cable.
Common error sources:
┌─────────────────────────────────────────────────────────────┐
│ Layer      │ Misunderstanding     │ Correction              │
├────────────┼──────────────────────┼─────────────────────────┤
│ L7 (app)   │ "Only the GUI"       │ Protocols live here     │
│ L4 (trans) │ "TCP always reliable"│ UDP for speed; ss -tuln │
│ L3 (net)   │ "Only local routing" │ Global via BGP; trace   │
│ L2 (data)  │ "Only switches"      │ VLANs; ip link vlan     │
│ L1 (phys)  │ "Pure hardware"      │ Drivers; ethtool        │
└────────────┴──────────────────────┴─────────────────────────┘
❗ Misunderstanding 4: Encapsulation is only theory — irrelevant on Linux. Wrong: every
pingencapsulates ICMP in IP in Ethernet. Miss that, and you do not understand why jumbo frames (large MTU) boost speed.
💡 Tip: Raise MTU with
ifconfig eth0 mtu 9000and test throughput withiperf— see how less encapsulation overhead saves bandwidth.
🔧 Practical example: In an LXC container (similar to Docker) debug encapsulation:
lxc-create -n test -t download -- --dist ubuntu --release noble --arch amd64
lxc-start -n test
lxc-attach -n test
# In the container: apt install tcpdump
tcpdump -i any -nn -c 5 icmp  # See encapsulation on ping from the host
That trains you to correct misunderstandings by observation.
⚠️ Warning: Avoid skipping layers — for example debugging layer 7 directly when layer 1 is down. Always start at the bottom:
ethtool eth0 | grep Linkfor layer 1, then up. In cloud setups such as AWS VPC that saves hours.
These tips make you fit for practice — train in a VM lab, and you will notice how OSI eases admin life.
Application and troubleshooting
Now that you have the theory of the seven layers, put it into practice.
This part shows how the OSI model helps on real network problems. You learn to use tools such as Wireshark to analyse traffic and hunt faults systematically.
As a beginner you will notice how the model gives you a clear path: instead of poking at random, you check layer by layer whether everything fits. In Linux environments, for example when troubleshooting a Docker cluster or a home server, that becomes daily bread.
What happens here? You take theoretical concepts and apply them to real traffic. Wireshark, the leading open-source packet analyser, lets you watch the data flow on all layers — from bits (layer 1) to application data (layer 7).
You start captures, filter by protocol and dissect packets to see where it sticks. That is essential to find bottlenecks or close security holes.
Why does that matter?
In admin practice you save hours: a “no connection” error might be the cable (layer 1) or routing (layer 3) — the model guides you. Especially in modern setups such as Kubernetes, where pods talk over networks, it helps you locate outages quickly and keep systems stable.
What should you watch especially? Use a current stable Wireshark (4.6.x) with solid protocol inspection. Install it on Ubuntu via sudo apt install wireshark and allow non-root captures with sudo dpkg-reconfigure wireshark-common.
Watch filter syntax: for example http for layer 7 or ip.src == 192.168.1.1 for layer 3. And always: capture only what you need, to save memory.
🔧 Practical example:
Start Wireshark and capture traffic — ideal for your Linux setup:
sudo wireshark &
# Pick an interface (e.g. eth0), start capture
# Open a browser, load a page — stop and analyse
That shows you the full stack in real time.
❗ Typical pitfall: You capture everything and drown in data. Fix: filter first, for example
tcp.port == 80 or tcp.port == 443, to see only web traffic. Or export captures withtshark -r capture.pcap -Y "http" -T fields -e frame.time -e ip.src -e http.request.urifor CLI analysis.
Exercise 1: analyse an HTTP connection
Here you practise breaking a web request down layer by layer — useful for beginners to grasp the data flow. You see the TCP handshake (layer 4), IP routing (layer 3) and HTTP requests (layer 7).
- What happens here? Wireshark captures the connection setup and shows how packets travel through the layers.
- Why does that matter? In practice you debug slow sites or dropped connections on your Linux web server this way.
- What should you watch? The 3-way handshake — SYN, SYN/ACK, ACK — and RTT (round-trip time) for latency.
- How do you use this later? On Nginx or Apache setups: analyse whether SSL handshakes (layer 6) fail, and check with
nginx -tfor config errors.
HTTP connection setup
┌─────────────────────────────────────────────────────────────┐
│   HTTP connection setup                                     │
│                                                             │
│   ┌──────┐                       ┌──────┐                   │
│   │Client│                       │Server│                   │
│   └──┬───┘                       └──┬───┘                   │
│      │     ── TCP SYN ──▶           │   ← layer 4           │
│      │     ◀─ TCP SYN/ACK ─         │                       │
│      │     ── TCP ACK ──▶           │                       │
│      │                              │                       │
│      │     ── HTTP GET ──▶          │   ← layer 7           │
│      │     ◀─ HTTP 200 OK ─         │                       │
│      │     ── TCP FIN ──▶           │   ← session end (L5)  │
│      │     ◀─ TCP FIN/ACK ─         │                       │
└─────────────────────────────────────────────────────────────┘
Task:
- Install Wireshark and start it.
- Pick your interface, filter with
http. - Open a browser, visit a site such as example.com.
- Stop the capture and identify:
- Layer 4: TCP handshake and ports
- Layer 3: IP addresses and TTL
- Layer 7: HTTP methods (GET/POST) and status codes
💡 Tip: Colour coding in Wireshark helps — red packets hint at errors. Adjust filters:
frame contains "GET"for specific requests.
Exercise 2: protocol analysis
Now you go deeper into packet layout — you learn to dissect headers and see how encapsulation works.
- What happens here? You zoom into a packet and see layers stacked: HTTP over TCP over IP over Ethernet.
- Why does that matter? It helps you find protocol-specific issues, for example wrong IP headers in a VPN tunnel.
- What should you watch? Header sizes — too much overhead eats bandwidth. Check CRC in layer 2 for bit errors.
- How do you use this later? On Docker networks: analyse whether overlays (layer 2/3) encapsulate packets correctly, with
docker network inspect.
Packet layout in Wireshark
┌─────────────────────────────────────────────────────────────┐
│   Packet layout in Wireshark                                │
│   ┌─────────────────────────────────────────────────────┐   │
│   │ HTTP header      ← layer 7: method, URI, status     │   │
│   ├─────────────────────────────────────────────────────┤   │
│   │ TCP header       ← layer 4: ports, seq, ACK, flags  │   │
│   ├─────────────────────────────────────────────────────┤   │
│   │ IP header        ← layer 3: IPs, TTL, protocol      │   │
│   ├─────────────────────────────────────────────────────┤   │
│   │ Ethernet frame   ← layer 2: MACs, type, CRC         │   │
│   └─────────────────────────────────────────────────────┘   │
└─────────────────────────────────────────────────────────────┘
Task:
- Open a capture in Wireshark.
- Pick a packet, expand the details.
- Note header info: for example TCP flags (SYN) or IP fragmentation.
- Export as JSON with
tshark -r capture.pcap -T jsonfor scripting.
⚠️ Warning: On sensitive data, anonymise IPs in the capture before you share it. In Wireshark use Edit → Preferences → Protocols and disable name resolution if you do not want hostnames leaked.
Exercise 3: troubleshooting
Here you learn to approach problems systematically — from physical up to the application.
- What happens here? You simulate faults and use the model to locate them.
- Why does that matter? It saves time in outages: for example in a Linux cluster where a pod is unreachable.
- What should you watch? Start at the bottom: link status (layer 1), then MAC (2), IP (3) and so on. Do not ignore logs.
- How do you use this later? In systemd networks:
networkctl statusshows layer-1/2 info, combined with Wireshark for higher layers.
Problem-analysis strategy
┌─────────────────────────────────────────────────────────────┐
│   Symptom: no connection                                    │
│      │                                                      │
│      ▼                                                      │
│   Layer 1:  cable / link OK?     (ethtool eth0)             │
│   Layer 2:  MAC / ARP OK?        (ip neigh)                 │
│   Layer 3:  IP / routing OK?     (ip route)                 │
│   Layer 4:  ports open?          (ss -tuln)                 │
│   Layer 5-7: app / protocol?     (curl -v)                  │
└─────────────────────────────────────────────────────────────┘
Task:
- 1. Simulate a fault: unplug a cable (layer 1) or block a port with
ufw deny 80. - 2. Capture with Wireshark, identify the layer.
- 3. Fix and verify: for example
ufw allow 80and recapture.
💡 Tip: Wire Wireshark into scripts with tshark for automation — for example
tshark -i eth0 -f "tcp port 80" -c 100 > log.txtfor batch analysis.
❗ Typical pitfall: You search in
layer 7, but it sits inlayer 1(bad signal). Fix: usemtr targetfor combined ping/traceroute, which covers layers 1–3.
These exercises build confidence — try them in a VM lab, and you are ready for real network challenges.
Command Reference (Cheatsheet)
The following reference collects the essential Linux commands for walking the OSI stack:
| Layer | Command | Purpose |
|---|---|---|
| L1 | ip link show eth0 |
Link state, MAC, MTU |
| L1 | ethtool eth0 |
Speed, duplex, autoneg, carrier |
| L1 | ethtool -t eth0 |
Offline self-test of the NIC |
| L2 | sudo tcpdump -i eth0 -e -nn |
Frames with MAC headers |
| L2 | ip neigh / arp -a |
IP-to-MAC (ARP) table |
| L2 | ip link add link eth0 name eth0.10 type vlan id 10 |
VLAN sub-interface |
| L3 | ip route show |
Routing table |
| L3 | sudo ip route add 10.0.0.0/24 via 192.168.1.1 |
Static route |
| L3 | traceroute google.com / mtr target |
Path and hop faults |
| L4 | ss -tuln |
Listening TCP/UDP ports |
| L4 | sudo tcpdump -i eth0 tcp port 443 -n |
TCP handshake |
| L4 | sysctl net.ipv4.tcp_congestion_control |
TCP congestion algorithm |
| L6/L7 | curl http://localhost |
Application reachability |
| L6 | openssl s_client -connect server:443 |
TLS presentation |
| L7 | dig @8.8.8.8 google.com |
DNS (UDP/53) |
| All | sudo tcpdump -i eth0 -XX -c 10 port 80 |
Headers from L2 up |
| All | tshark -r capture.pcap -Y "http" |
Filter a capture on the CLI |
Further Resources
Official documentation
To go deeper, use proven sources that give you solid insight. These documents are the base for serious network study and help you match theoretical concepts to standardised specifications.
As a beginner start with the user manuals before you move to RFCs — they are often dry, but essential for certifications such as LPIC or CCNA.
Practical learning resources
Here you find platforms and simulators that help you try the OSI model hands-on without expensive hardware. Ideal for a home lab or exam prep — build virtual nets and simulate faults to practise troubleshooting.
Tools and utilities
These tools are your kit for daily network work — from scanning to emulation. Pick based on your distro, for example Ubuntu, and update regularly via apt.
| Resource | Description | Type |
|---|---|---|
| ISO/IEC 7498-1 — OSI Basic Reference Model | Official OSI reference | Standard |
| RFC 1122 — Internet host requirements | How TCP/IP hosts must behave | RFC |
| Wireshark user guide | Capture, filters and dissection | Documentation |
| Wireshark | Protocol analyser | Tool |
| Nmap | Network scanner | Tool |
| Cisco Networking Academy | Structured networking courses | Course |
| Packet Tracer | Network simulator | Simulator |
| GNS3 | Network emulator | Emulator |
| TCP/IP protocol family | The four-layer stack used on the internet | Article |
| Public vs private IP addresses | Layer-3 addressing and NAT | Article |
Conclusion
The OSI model remains a reliable compass in networking — it splits complex flows into manageable parts and makes troubleshooting efficient. You have seen how the layers interact from physical bit transfer up to the application, and how tools such as Wireshark make that visible. In Linux environments, whether server setups or container nets, you use this daily to keep stability.
Remember: each layer solves specific challenges, from routing problems to protocol errors. With this knowledge you build robust systems that scale and stay secure.
💡 Tip: Start small: take your next network problem and apply OSI — start at layer 1, check cable and link status via
ethtool eth0. You will notice how quickly you reach a solution instead of guessing for hours.
In your Linux lab: build a simple setup with Docker nets and analyse traffic — that sharpens understanding and makes you more confident. Later, on larger projects such as cloud migrations, you save time and resources. Keep at it, try it — the more often you use OSI, the more natural it becomes.